Engaging Math Lessons.

Please browse our selection of mathematics lessons sorted by subject and current common core standards for improving math achievement for every student.

Basic Math: Grade 8

Below are a set of lesson plans and worksheets for Grade 8 Math that correspond to Common Core concepts and help students solve real-world problems. Lesson previews provide a quick glimpse at the provided materials.
  • Concept:

    Statistics & Probability
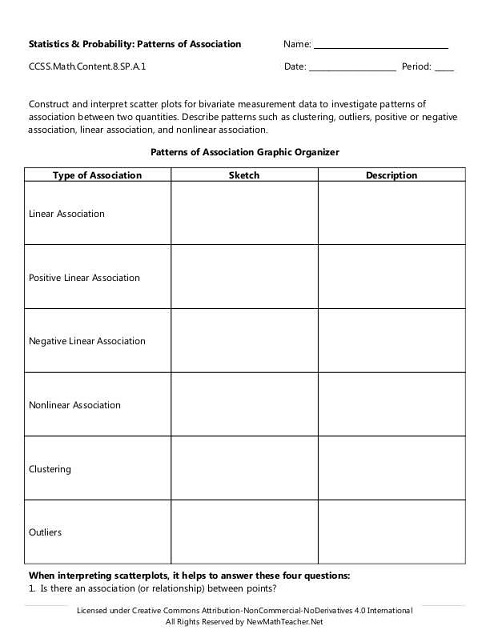
  • Common Core Standard: CCSS.Math.Content.8.SP.A.1
  • Description: Construct and interpret scatter plots for bivariate measurement data to investigate patterns of association between two quantities. Describe patterns such as clustering, outliers, positive or negative association, linear association, and nonlinear association.
  • Visit our TPT Store for Download
statistics basic math image
  • Concept:

    Statistics & Probability
  • Common Core Standard:CCSS.Math.Content.8.SP.A.2
  • Description: Know that straight lines are widely used to model relationships between two quantitative variables. For scatter plots that suggest a linear association, informally fit a straight line, and informally assess the model fit by judging the closeness of the data points to the line.
  • Visit our TPT Store for Download
statistics basic math image
  • Concept:

    Statistics & Probability
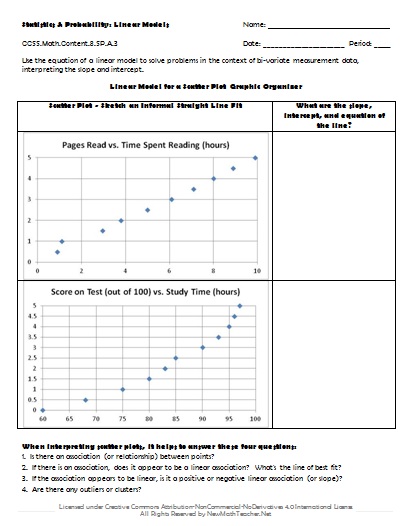
  • Common Core Standard:CCSS.Math.Content.8.SP.A.3
  • Description: Use the equation of a linear model to solve problems in the context of bivariate measurement data, interpreting the slope and intercept.
  • Visit our TPT Store for Download
statistics basic math image
  • Concept:

    Statistics & Probability
  • Common Core Standard:CCSS.Math.Content.8.SP.A.4
  • Description: Understand that patterns of association can also be seen in bivariate categorical data by displaying frequencies and relative frequencies in a two-way table. Construct and interpret a two-way table summarizing data on two categorical variables collected from the same subjects. Use relative frequencies calculated for rows or columns to describe possible association between the two variables.
  • Visit our TPT Store for Download
statistics basic math image

Follow us